|
| |
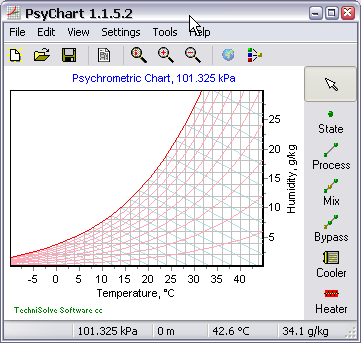
Airconditioning starts with psychrometry
[ Up ] [ ACSpec ] [ AirState ] [ DutyCalc ] [ Excel ] [ Chart Plotter ] [ TextBook ]
No matter what you do in the airconditioning industry, you will
at some stage, have to use a psychrometric chart. Plotting a process on
the psychrometric chart allows you to calculate the total duty, sensible duty
and humidification rate. On a paper chart, you are restricted to the scale
of the chart and the barometric pressure. This program overcomes all these
limitations and much more. You are free to link processes together to
build the complete airconditioning cycle.
 |
- Quick, easy and accurate psychrometric calculations.
- Drag & Drop air states and processes onto the chart.
- Join processes together to form any air-conditioning or
refrigeration system.
- Generate detailed reports and chart graphic.
- Links to real equipment designers.
- Set barometric pressure from
World Location database.
- Read data files directly into
spreadsheet for post-processing.
- Automatically send chart by email.
- Component palette of fundamental psychrometric processes.
- Includes property editors for air state, and all common
processes.
- Zoom in and out to make best use of chart space.
|
|
If you double click on any of the components, a property editor will appear.
The one shown here is the moist air bypass editor that applies to a cooling coil
process on the chart.
This is a smart calculator in itself. As you edit any value, the other
values will automatically be updated so that the last two values will be used to
calculate the correct duty.
|
 |
 |
We have catered for all unit types in a special way. Rather than
forcing you to select a unit set, we allow you to change the units of any
field. The program remembers your selection and you can freely flick
between options to do conversions. |
|
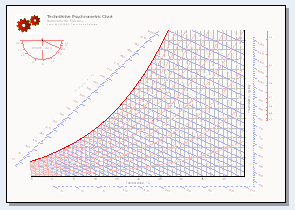
Once you have done the calculations, print the final chart to a really
professional with all the property lines for inclusion into your report.
This is also a stand-alone program that you can use to generate your own
paper charts. You can even customize the chart to include your own
logo.
more... |
 |
| |
|
Excel Spreadsheet
You can also use the TechniSolve PsyChart directly in your
Excel spreadsheet.
We have developed a very powerful psychrometric library that can be used from
within Excel, or any other program. This means that in your spreadsheets,
you can now incorporate any of the properties of moist air states without
writing a single line of code.
[More Info...]
|